 Ouzel Climate
See what climate risk costs your company, and what it would cost to cut it
Ouzel Climate works out your carbon liability, compares your options for reducing it, and writes the disclosure report for your standard.
Reports for IFRS S2 · UK SRS S2 · AASB S2
You can preview every step without a card.
- 1Enter your numbers
Emissions, financials and risk, once. - 2See what it costs
Carbon cost, scenarios and risks worked out. - 3Get your report
Liability, reduction options and disclosure, as PDF, Word, Excel or CSV.
Read a full sample report
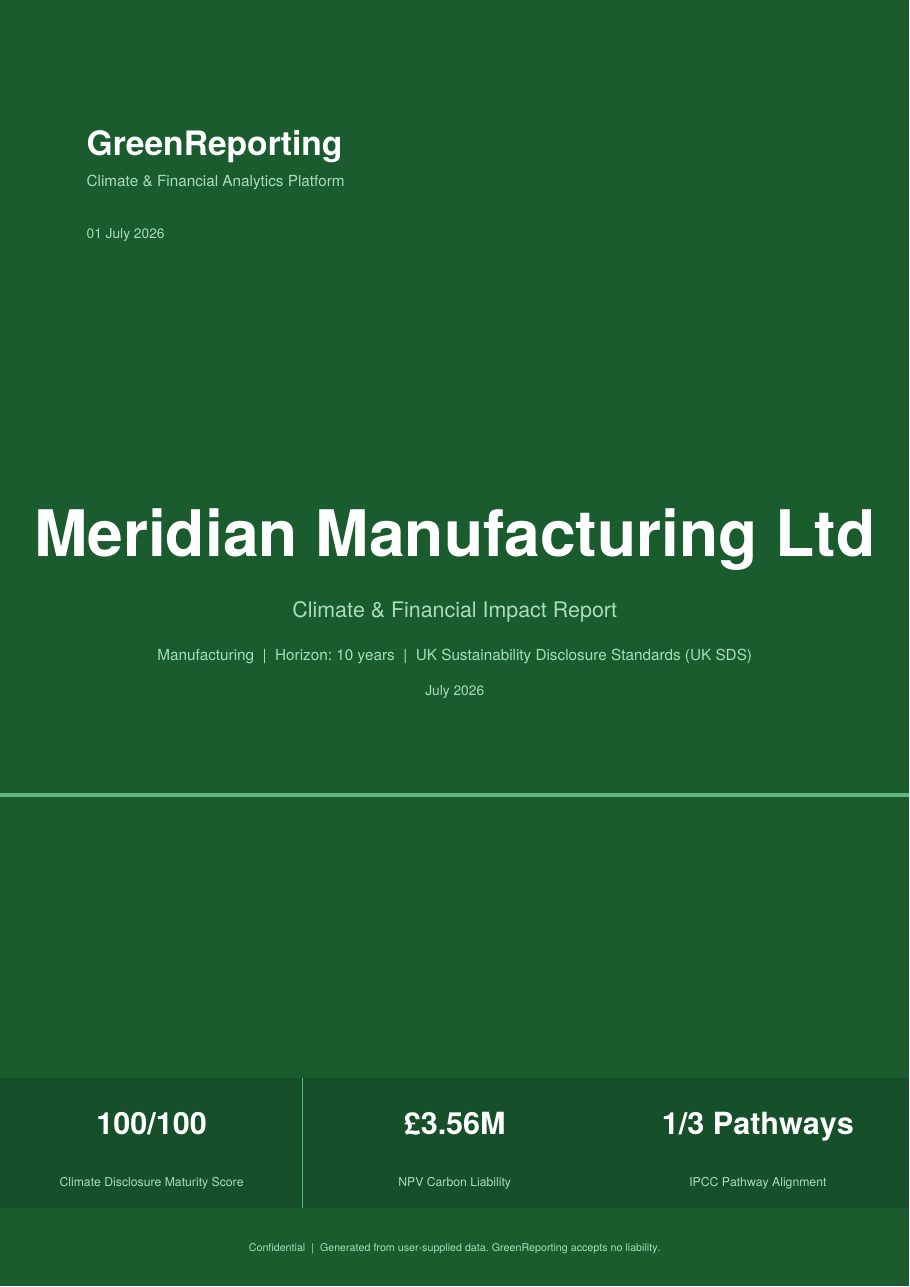
Fourteen sections and five appendices, generated by Ouzel Climate for an illustrative company. One PDF for each standard: UK SRS, AASB S2 and IFRS S2.
We ask for your email so we can send them.
What is inside the report
What your emissions cost
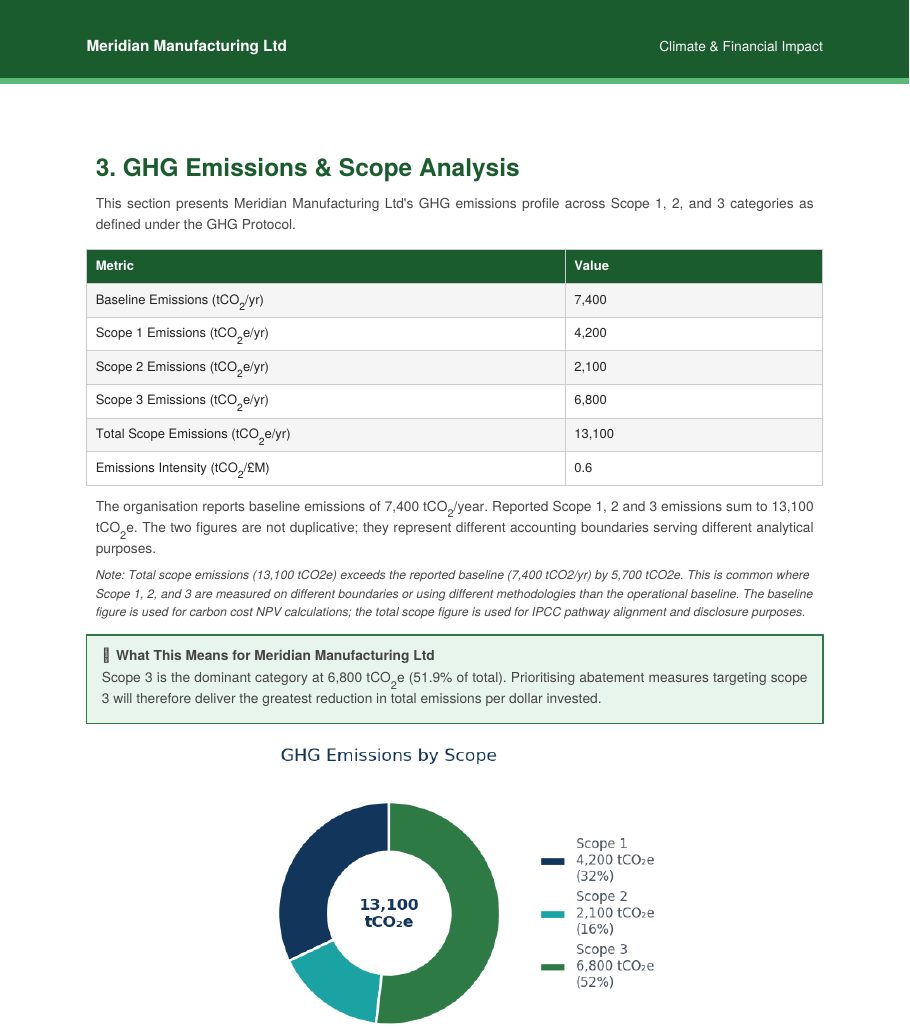
Your carbon liability: a year-by-year cost of your Scope 1, 2 and 3 emissions at a carbon price you choose, with sensitivity to that price.
Sections 3, 4 and 10
What it would cost to cut them
Indicative reduction options with their cost per tonne, so you can see which measures are cheapest to start with.
Section 5
Where you stand against 1.5°C
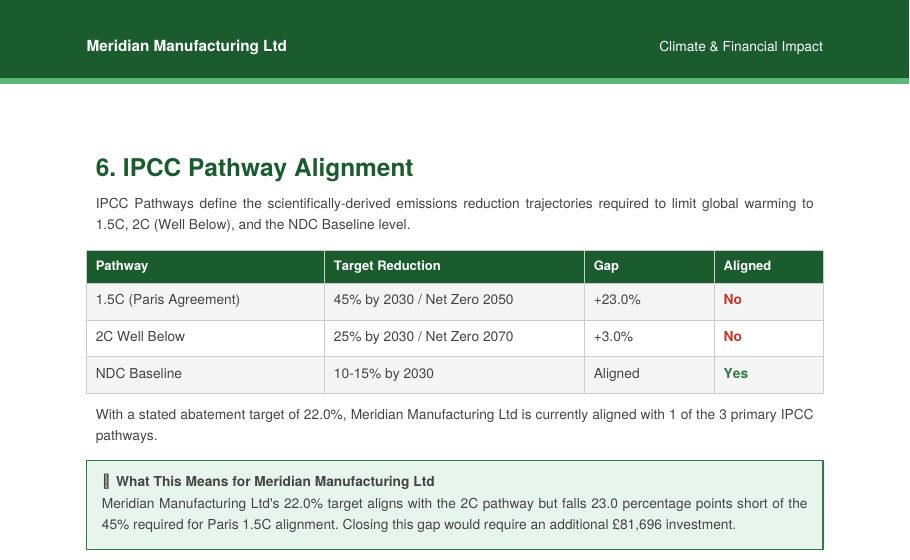
Your reduction target tested against the 1.5°C, 2°C and NDC pathways, with the gap in percentage points.
Sections 6 and 8
Which risks reach the board
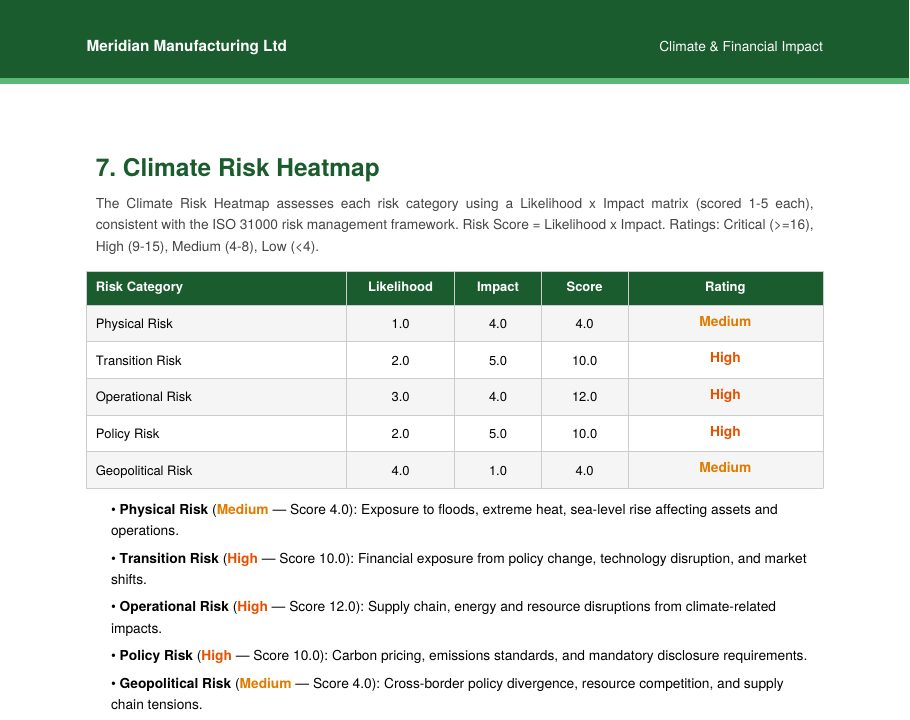
Physical, transition, operational, policy and geopolitical risks scored by likelihood and impact, on one heatmap.
Sections 7 and 11
Try the calculation on your own numbers
Both worksheets use the same method as the report. Move any input and the result updates.
Carbon cost exposure
Emissions grow 2% a year from your baseline, so year 1 is already 2% higher. The carbon price stays constant in today's terms. Each year's cost is discounted at 8%, as if it falls at the end of the year. An estimate only, not financial, legal or regulatory advice.
Emissions intensity
Our sector benchmarks are internal estimates and do not yet state which scopes they cover, so read the comparison as a rough guide, not a ranking.
What each reader gets, and the decisions it supports
- What carbon price to use in capital allocation
- Which reduction measures to fund first
- What exposure to disclose to lenders and investors
- Which risks go to the board
- Who owns each risk and what to budget for mitigation
- How resilient the business is under each scenario
- Whether the target is ambitious enough for 1.5°C
- What to fix in the data before verification
- What to say in the external disclosure
See the real output before you start
Climate Disclosure Readiness Checklist
The five pillars common to IFRS S2, UK SRS and AASB S2. Assess where your organisation stands before preparing a formal disclosure.
Full sample report
A complete climate and financial impact report as a PDF, for an illustrative company. Pick the standard you are most interested in. We ask for your email so we can send it.
Annual plans
Every plan includes all three standards and every export format. Prices are shown in US dollars, with pound and Australian dollar prices for UK and Australian customers. Choose a 1, 2 or 3 year term: 2 years saves 15% and 3 years saves 25%.
Professional
For solo practitioners and individual sustainability officers.
- 1 user, 6 reports a year
- PDF, Word, Excel and CSV exports
- IFRS S2, UK SRS or AASB S2, chosen per report
Team
For sustainability teams and mid-size organisations.
- Up to 5 users, 20 reports shared across the team
- Everything in Professional
- Team admin dashboard
- Shared reporting across clients or entities
Enterprise
For large organisations and consulting firms.
- Unlimited users and reports
- White-label options
- API access
- Everything in Team
Questions we are asked
What is the methodology?
Every figure in the report comes from a fixed calculation, not from a language model. You can reproduce each one from the inputs listed in Appendix A.
- Carbon cost. Emissions in year t are your baseline grown at your growth rate: Et = baseline × (1 + g)t. Cost in year t is Et × carbon price. Each year is discounted at your rate, cost ÷ (1 + r)t, and the years are summed. The defaults are 2% growth and an 8% discount rate. See the worked example.
- Reduction cost. Each reduction measure is costed per tonne of CO2e it avoids, so measures can be ranked. These are indicative figures, not quotes.
- Emissions intensity. Scope 1, 2 and 3 emissions divided by revenue in millions of dollars, compared with an indicative sector benchmark.
- Pathway alignment. Your reduction target is compared with the global pathways for 1.5°C and 2°C that the IPCC sets out for the Paris Agreement, and with national commitments (NDCs). The 1.5°C pathway used is a 43% cut in greenhouse gas emissions by 2030 from 2019 levels, with net zero CO2 around 2050, and the 2°C pathway is a 21% cut by 2030 from 2019 levels, both from the IPCC Sixth Assessment Report (2022). Reports issued before October 2026 used 45% and 25%, the figures from the IPCC 2018 special report, which measured CO2 against 2010.
- Risk score. Likelihood × impact, each from 1 to 5. A score of 16 or more is Critical, 9 to 15 High, 4 to 8 Medium, and below 4 Low.
- Scenarios and sensitivity. The report compares a 1.5°C and a 3°C world and shows how the result moves when carbon price and demand change.
- Emissions accounting. Scope 1, 2 and 3 follow the GHG Protocol. The disclosures follow IFRS S2, UK SRS or AASB S2, as you choose.
AI writes the narrative text in the report, including the disclosure wording. It is told to use only the figures and text you entered, and it does not calculate anything. Read all of the wording before you use it outside your company.
Is the report assured?
No. It is generated from the data you enter. The GHG readiness section checks your inventory for internal consistency before you seek verification. It does not replace third-party assurance.
Which standards does it cover?
IFRS S2, UK SRS and AASB S2. You choose the standard for each report, and the disclosures follow it.
Can I share a report with my auditors?
Yes. Export it as PDF, Word, Excel or CSV. The Excel and CSV files carry the underlying figures.
What happens when I have used all my reports?
You can buy more reports at any time.
Where is my data stored?
The data you enter and the reports you generate are stored in your account, under Reports, while your account is active, so you can download them again. See the privacy policy for the service providers we use.
Two products from Ouzel

IFRS S2, UK SRS and AASB S2 disclosure reports, with a data readiness check and a decarbonisation tracker.

Scope 1, 2 and 3 emissions accounting, targets and reduction plans, in one place.
Enter your numbers and see your own report
Preview every step of the wizard without a card.